Summary: In Aruba Central’s demos we do talk about APIs, but it requires prior knowledge in programming skills, install software/add-ons on our devices, which sometimes makes their execution complex. For this reason, in this post we want to present you a tool that will easy these demos with some specific use cases already tested.
At this time, integration through APIs is one of the factors that our clients are looking for to make next level networks, because APIs offer benefits such as greater monitoring capabilities, better visibility and network automation.
Aruba Central has several services that can be consumed through APIs, these are classified into different groups according to their function like Monitoring, Configuration, APPRF, among others. All Aruba Central APIs are documented into Swagger.
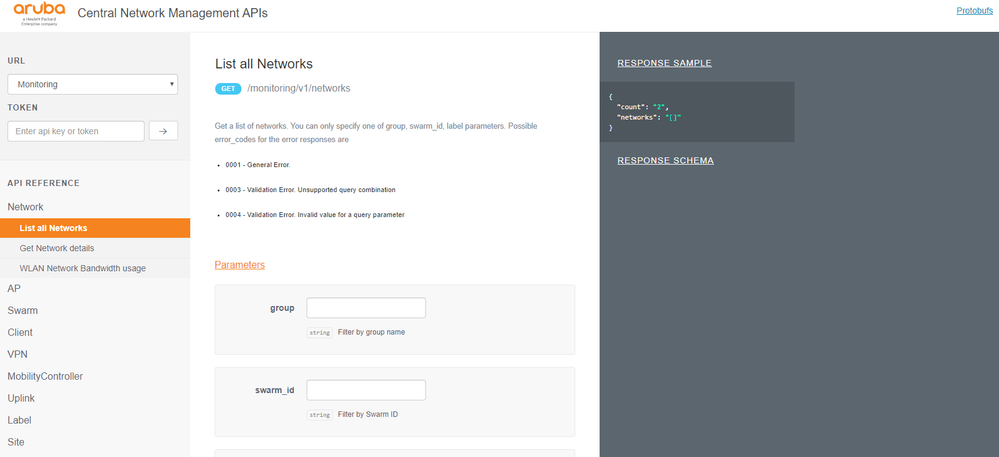
Swagger is a documentation framework that aims to help in the processes of design, documentation and consumption of APIs services. For this reason, in the page is indicated the type of request, the url and the parameters that should be used for each transaction. After the request is made, we get a response with the information/payload requested in a JSON format (it’s represented by a pair key: value that represents each characteristic). You can see an example in the following image when requesting the URL Monitoring to get the networks that are created in the Central account.
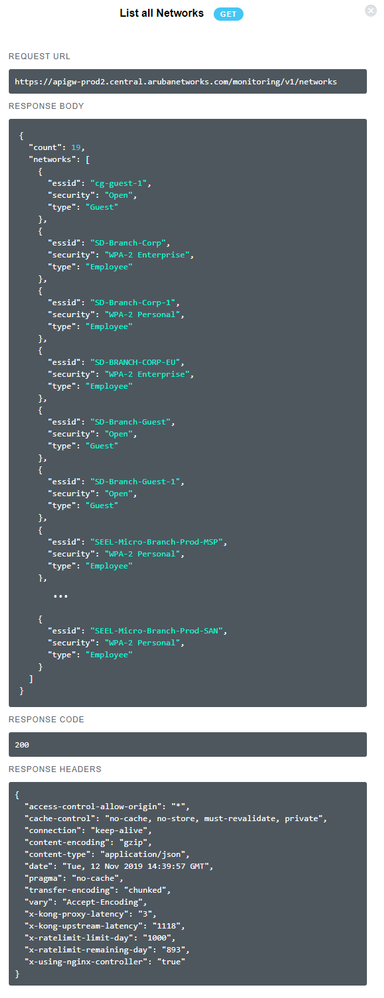
In the image you can identify:
- Request type: “GET” – Method used to do the request. You can use either Get, Post, Put, Patch, Delete.
- Request URL: https://apigw-prod2.central.arubanetworks.com/monitoring/v1/networks - Path where the call is being made, URL.
- Response Body: JSON with the requested information
- Response Code: 200 - In this case the request was successful. Response 2xx means success and 5xx represents an error in the call.
- Response Headers: Contains additional information about the response.
This understanding is critical for the development team of our clients, but it is not necessarily that we want to show across all levels in an organization, in some positions it could be better to present something more visual, more striking to show that what can do with APIs.
This was the case of a Service Provider in the region that wanted to create a customized portal via APIs, and in order to show the integration capabilities, a Dashboard was created with 6 specific use cases for monitoring; this way this project started.
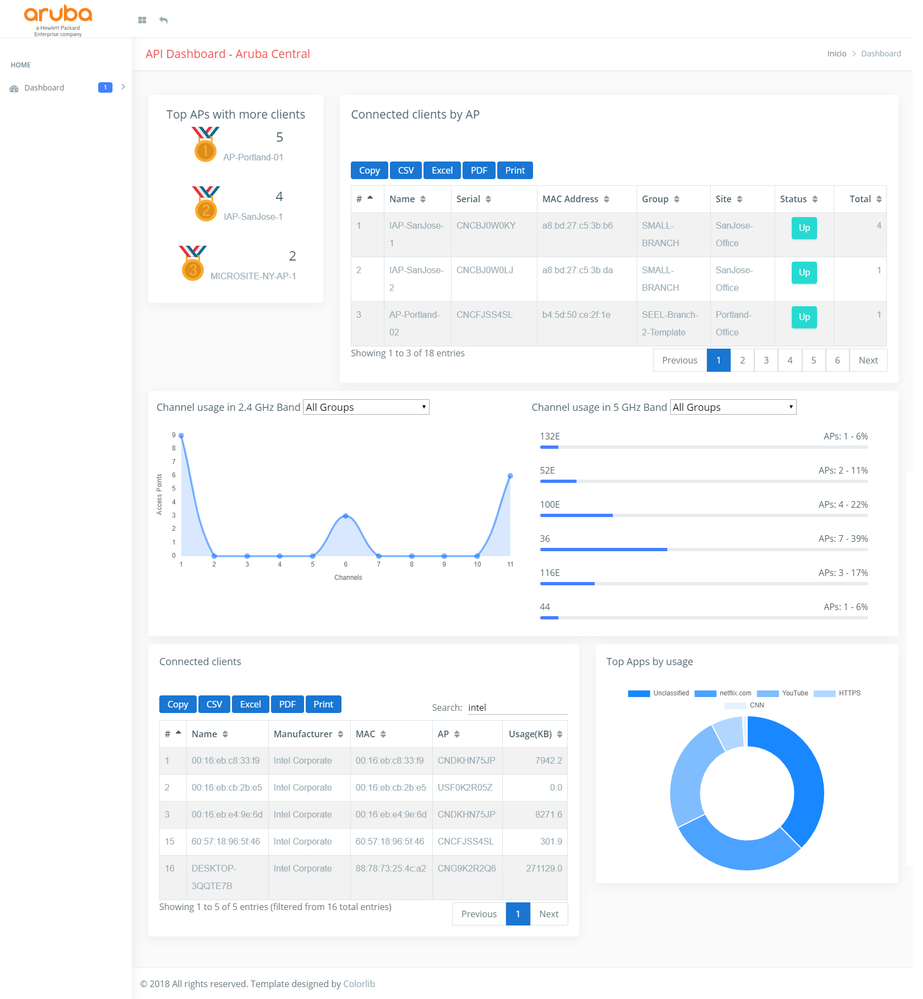
The dashboard was created using HTML for front-end and JS (JavaScript) to make the requests, but don't worry, you don't need to know anything about these tools to use the platform. In the picture below you can see what we propose:
We already said that it is not necessary to have previous programming knowledge to use this platform, but then how can you use it?
- Prerequisites: Must have
- You must have access to an Aruba Central account with provisioned Access Points and clients connected to the network. Note: If you do not have your own access to an account you can use the Central Aruba SEEL account.
- Internet connection through a search engine
- Generation of the Access Token:
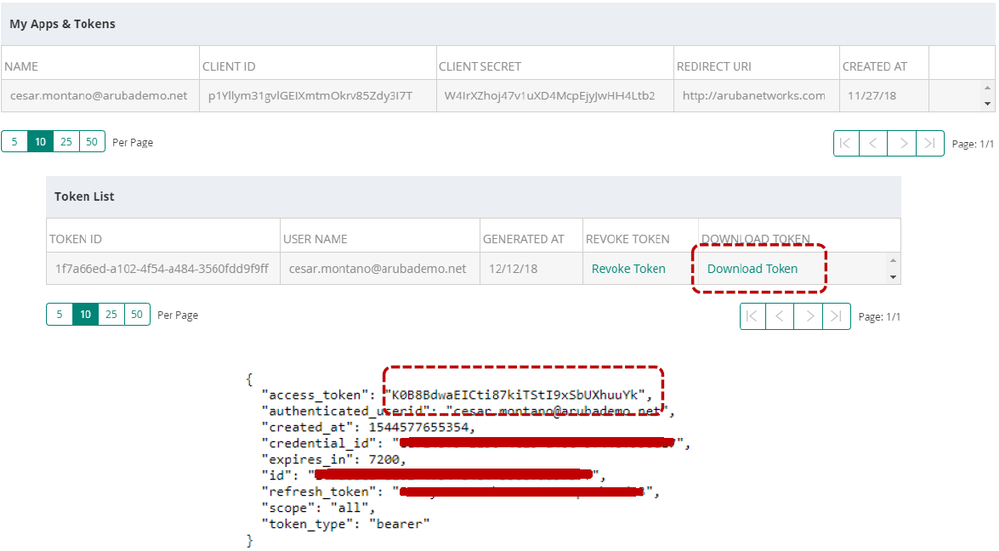
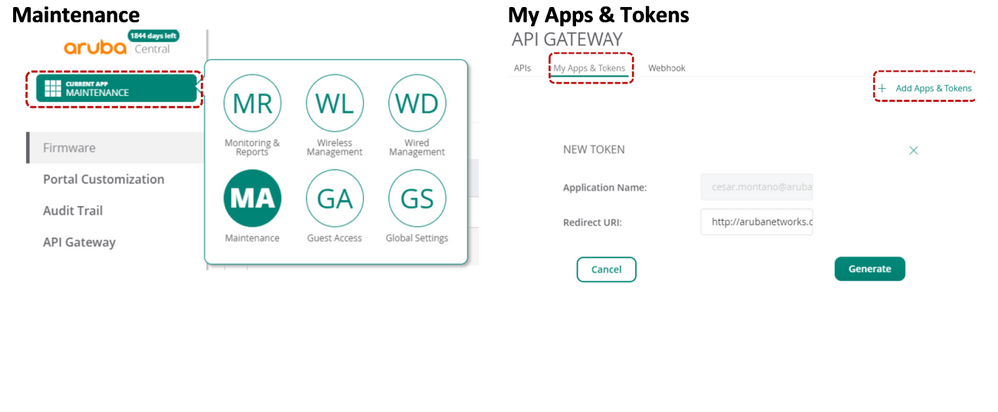
Although the information is going to be obtained through requests to URLs we must have an authentication mechanism to guarantee that we will have permissions level necessary to access the information, for this Aruba Central uses Access tokens. You can generate your own tokens by the option “Maintenance” - “API Gateway” - “My Apps & Tokens” - “+ Add Apps & Tokens” - “Download Token” and use the “Access_token” field
- Go to the portal:
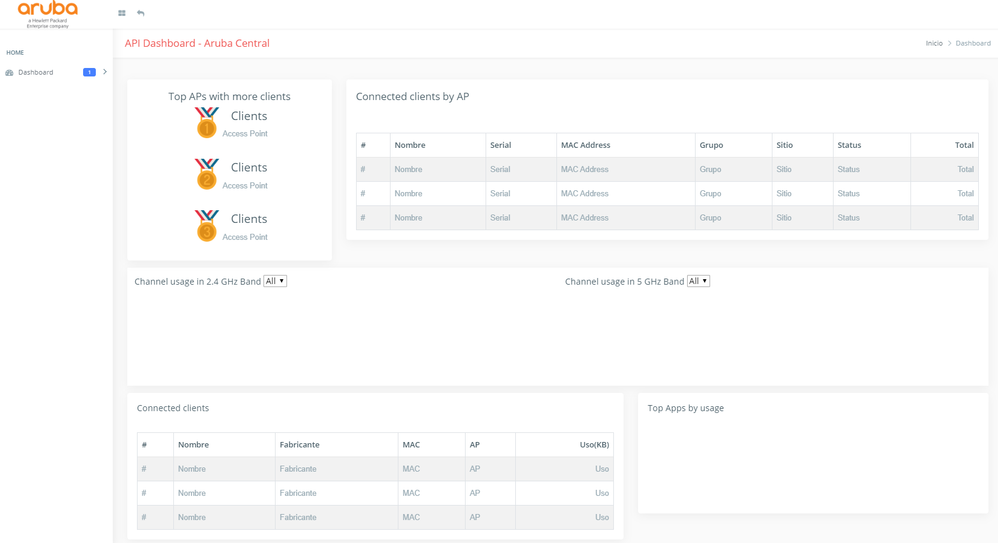
Enter the address http://arubalatam.net/ in your browser, as no request has been made, the fields with default values will appear
- Enter the Access token:
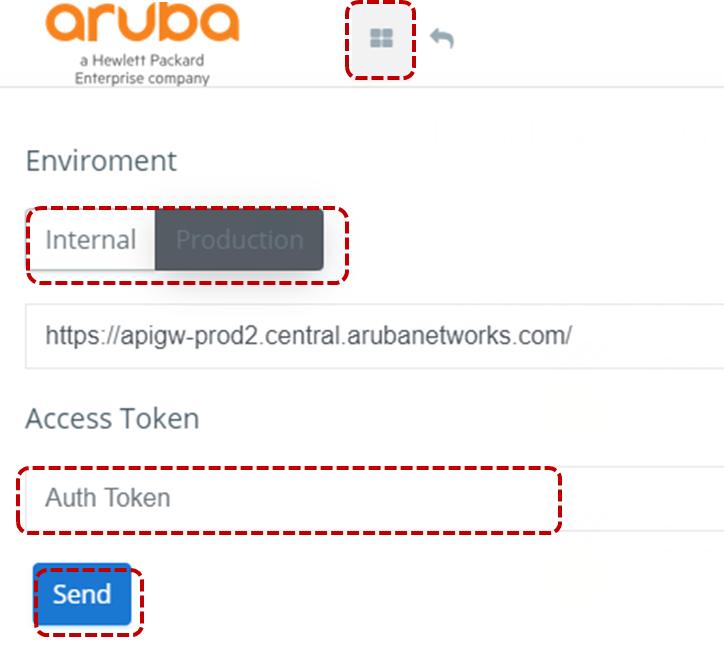
The Access Token contains information associated with the account in which it was generated, so, the application will take the information only from it. To enter it you must go to the top and select the icon with 4 boxes, this will open a panel in which you must select:
- Environment: You can select whether it is an internal or production environment. For the production environment at the moment ONLY “US-2” is supported
- Access Token: Enter the code generated in step 2
- Send: Execute the requests to complete the graphs
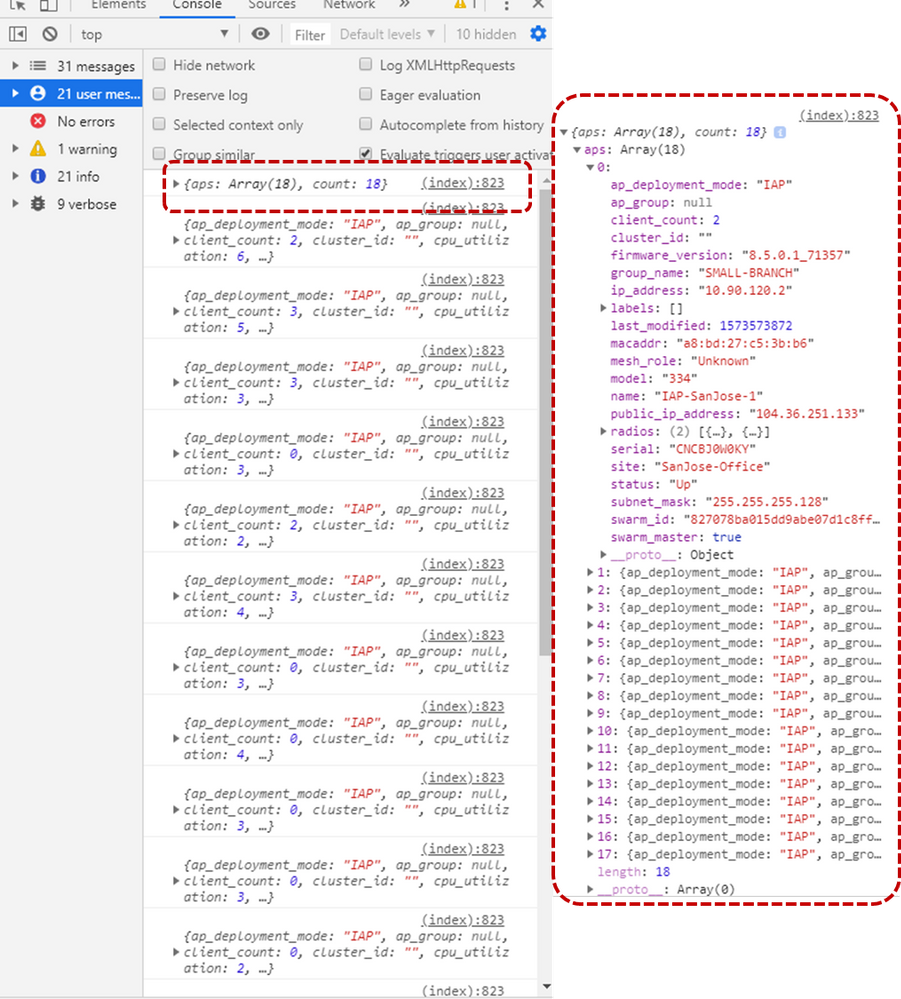
Note: We recommend you have the DevTools panel open in your browser (it opens when press F12), to see the requests that are being made and the response.
- Wait while requests are finished executing.
There are requests that depend on others, so the execution time will depend on the number of associated APs in the account. For example, to obtain the use of channels, first a request is made to obtain the provisioned APs, and then for each one it is looked at what channels are being used, therefore it could take a while. If you have the DevTools panel open in the browser (it opens when you press F12), you can see the requests and responses that are obtained in a format similar to JSON, which can be drill down to see the details.
- Explore the dashboard
The dashboard has 6 tiles:
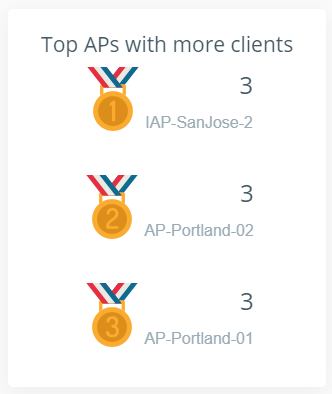
- The first tile shows the Top 3 of APs based on the number of connected clients. Central has an API available to determine the TOP N of APs according to bandwidth, so this graph shows that through requests you can process and analyze the information to create new measures that are aligned to the customer needs, in this case you could identify a possible unbalance between APs or overload. This chart includes the number of customers and the name of the AP.
- In the second one you can see the number of clients connected by AP. This element allows us to quickly export this information into CSV, Excel, PDF files or directly print it. Also being in a table format allows you to sort from highest to lowest values by the selected fields, and has an indexed menu to present information. Another important thing is the use of graphic elements in the tables as indicators in the case of Status "Up" is presented green and "Down" red that brings more customization.
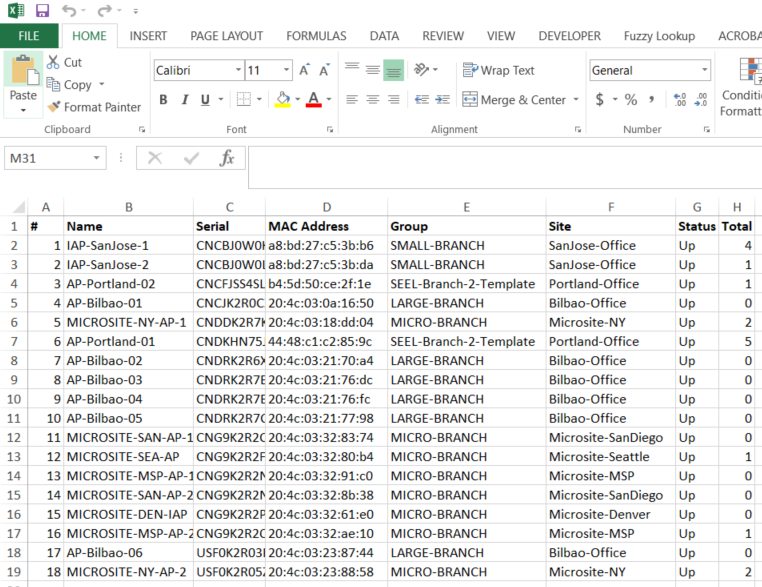 Exported Data to Excel
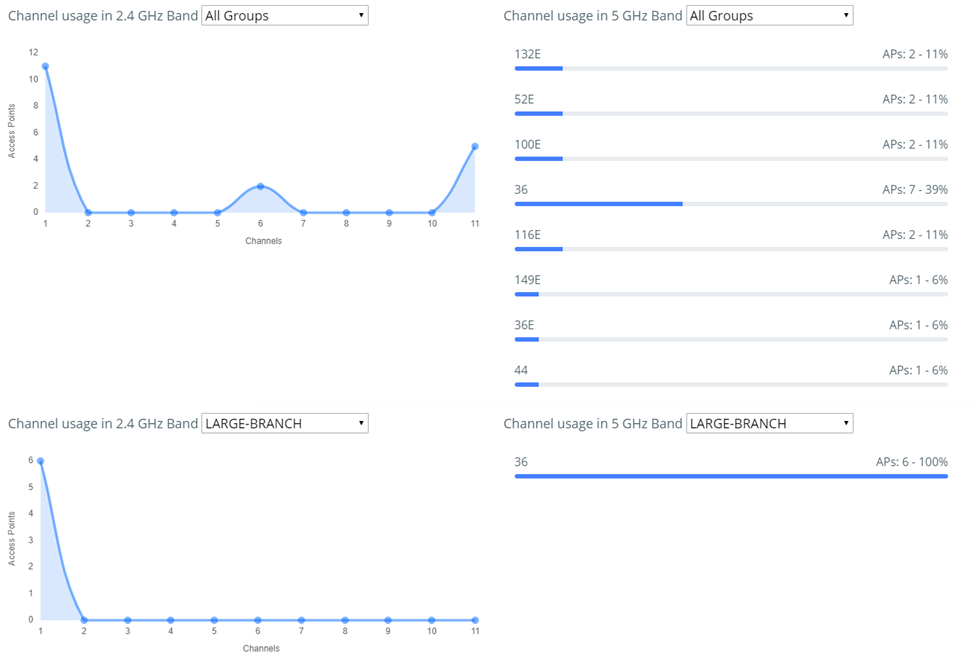
 - In the third and fourth tiles different types of graphs are presented showing the versatility of creating graphs and also, in the upper part of each one the option of drop-down filters that can be created to modify the information in the graphics. In the upper graph it is seen data without filter, and in the lower one with the filter applied
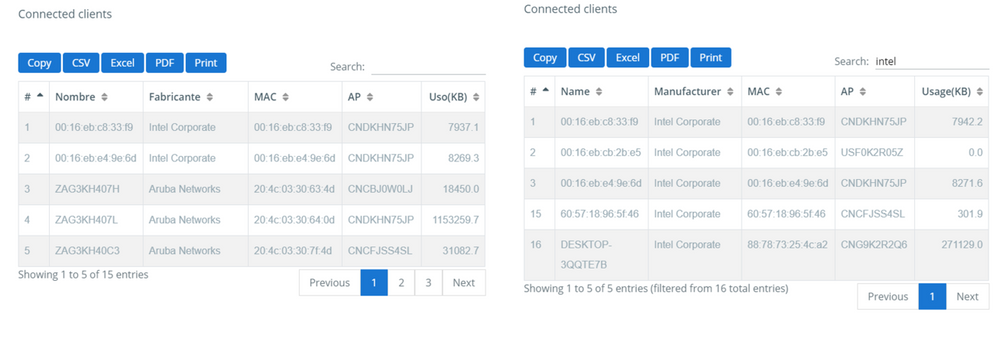
- In the fifth one, a table with the connected clients is displayed, with basic information about them, and like the other one, the information can be exported. Additional this table allows filters in the Search field, for the different values and export the information already filtered. In the left image we see the image without filter and then in the right image with the filter for “Intel” devices.
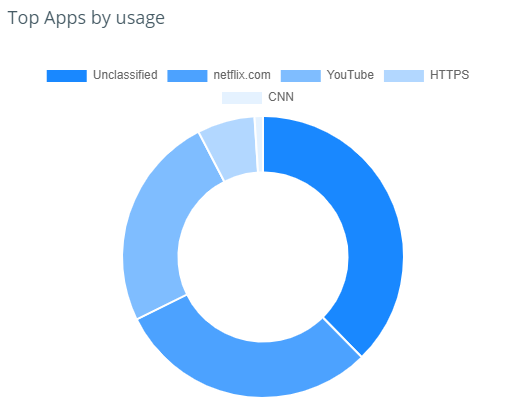
- Finally, we have another option to customize graphics with a doughnut chart
We hope you can use this tool, and we are building more so that they can be used throughout the community.
Feel free to contact us if you any question.
Created by: Cesar Montaño and Dayana Bravo