Network Management

last person joined: yesterday 

Keep an informative eye on your network with HPE Aruba Networking network management solutions
Expand all | Collapse all

From Network Operations Center of Aruba Atmosphere 2019 APAC

This thread has been viewed 1 times
  • 1.  From Network Operations Center of Aruba Atmosphere 2019 APAC

    EMPLOYEE
    Posted Sep 26, 2019 05:53 AM

    This post is about some interesting stats from Network Operations Center of Aruba Atmosphere 2019 APAC, in Sydney, Australia.

    Aruba Atmosphere 2019 APAC was hosted in ICC Sydney, Australia from September 24-26, 2019.

    Let me go straight into the Statistics.


    What did the Bill of Materials look like:

    2 X Aruba Mobility Master
    3 X Aruba 7210 Controller in Cluster
    165 X Aruba AP-515 (RW) Unified AP


    2 X Aruba 8320 48 10/6 40 as Core Switches
    -> VSX running between core switches and MC-LAG from Distribution/Access Switches.


    Distribution/Access Switches:
    18 X Aruba 2930F 8G PoE+ 2SFP+ Switch
    14 X Aruba 3810M 40G 8SR PoE+ Switch
    12 X Aruba 3810M 48G PoE+ Switch
    Aruba SFP+ and SFP Transceiver as required.


    Aruba Airwave - For Network Management
    Aruba Clearpass and Clearpass Device Insight - For Profiling and Access Control.


    32 X Aruba UXI Sensor for Assurance of user experience.
    150 X Bluetooth Beacons for indoor way finding.


    1 X Aruba 7210 Controller as Gateway
    DHCP/DNS Server


    How many people did it take to build and run the network ?

    Just 3 Aruba Engineers  :)


    Network Statistics:

    Clients Connected:

    The maximum no of client devices connected at one point of time were close to 1000.Airwave1.jpg
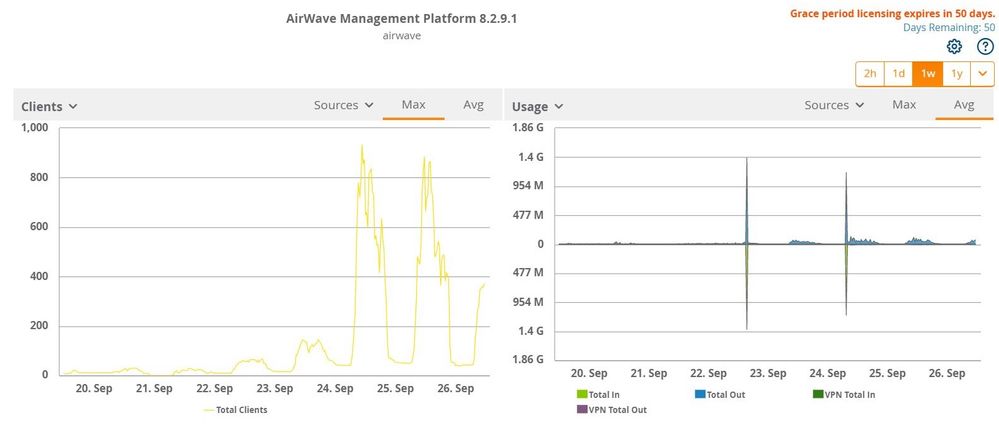


    Traffic Generated:


    The Atmosphere Event was conducted across Convention building, Exhibition building and the Darling harbour theatre where keynote was conducted. Total traffic generated were close to 25 TB !Traffic Generated.jpg


    Clients by Connection Mode:

    Around 100 clients were using 802.11ax (WiFi6) as a connection mode.
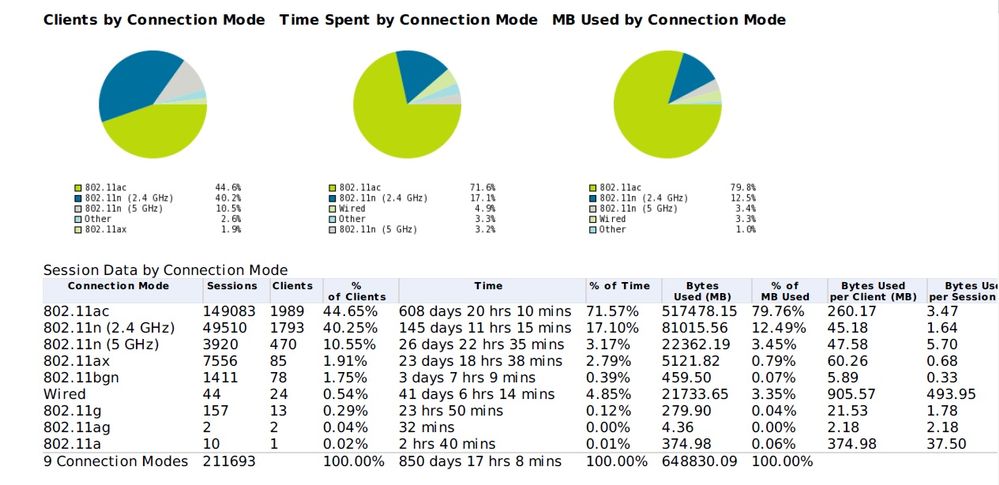
     

    Clients by Connection Mode.jpg

    Atmosphere SSID was open with captive portal page enabled.

    We enabled "Enhanced Open" that provided unauthenticated data encryption for Open Wi-Fi Network.


    Statistics from Grafana and Kibana:

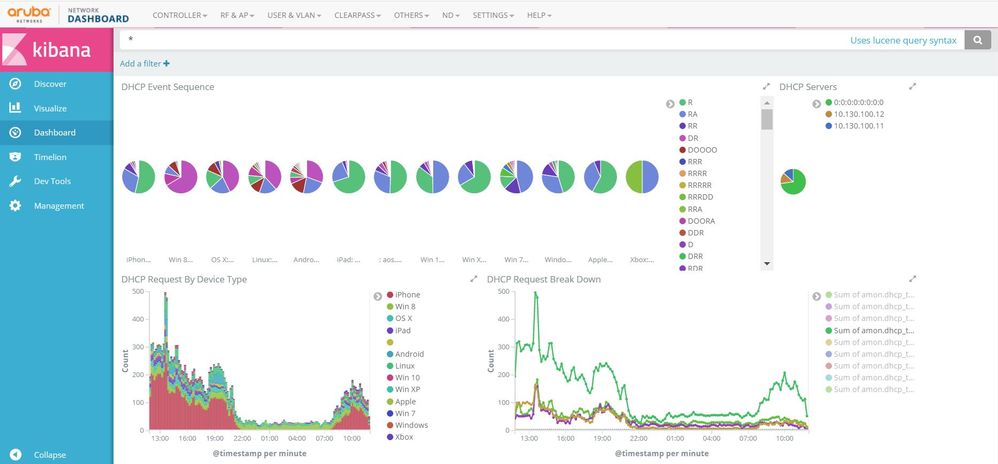
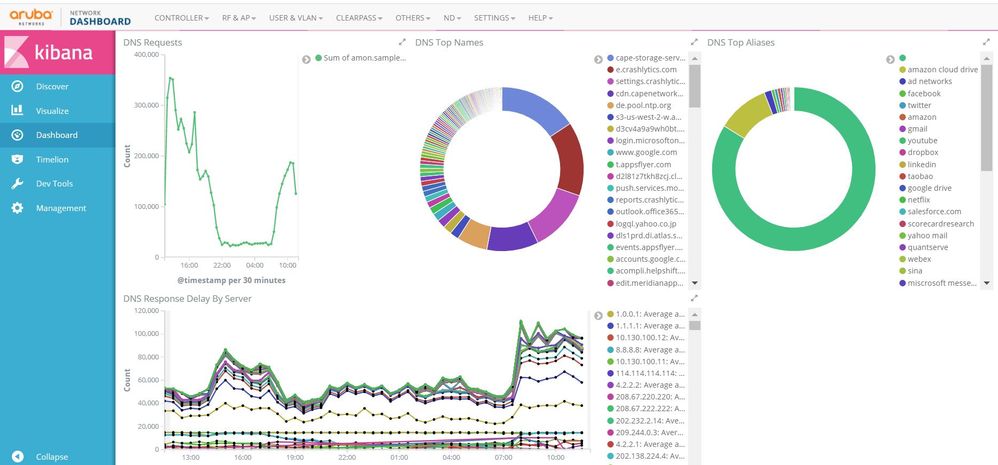
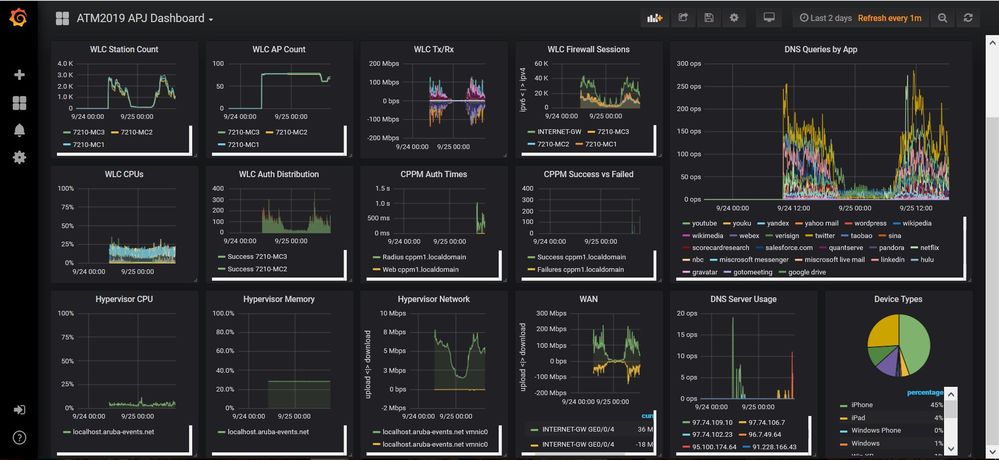
    We fed AMON, SNMP and Syslog information from Network devices like Aruba Controller, Clearpass, Hypervisor, DNS/DHCP and Gateway to Grafana and Kibana.


    Grafana, is designed for analyzing and visualizing metrics such as system CPU, memory, disk and I/O utilization.Grafana2.JPG


    Kibana, on the other hand, runs on top of Elasticsearch and is used primarily for analyzing log messages.

    Channel Distribution by Band:
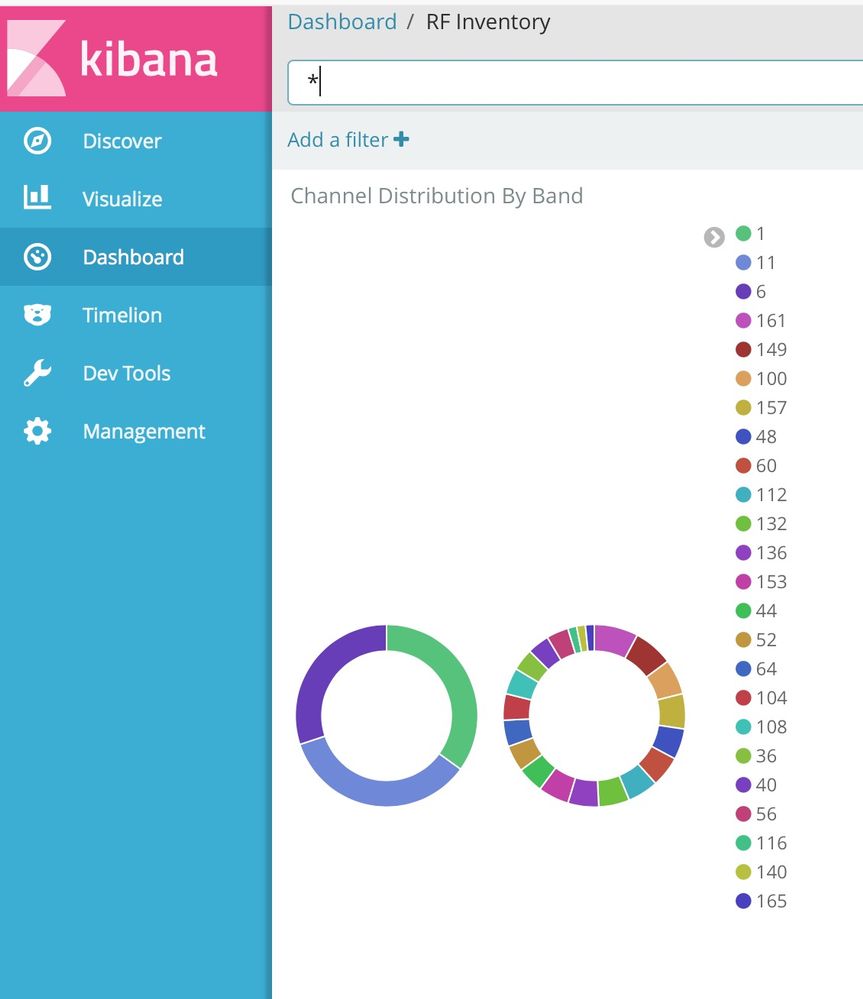
     

    Channel Distribution by Band.jpeg


    DHCP Dashboard:Kibana DHCP.JPG


    DNS Dashboard:DNS Dashboard.JPG


    Fireworks to conclude:

    We celebrated the final night at Aruba Atmosphere 2019 APAC, with Fireworks. This is one of the picture captured from my phone.


    Firework.jpg


  • 2.  RE: From Network Operations Center of Aruba Atmosphere 2019 APAC

    MVP GURU
    Posted Sep 26, 2019 06:13 AM

    Hi! that's really great! you all rock! Are you feeding Grafana and Kibana with data coming from the VSX (Core) too? if yes can you provide more insights about that? if not, how are dealing day-to-day monitoring of Aruba 8320's VSX? I'm not yet a real WiFi guy so I'm really interested in knowing how you deal with the wired side.


  • 3.  RE: From Network Operations Center of Aruba Atmosphere 2019 APAC

    EMPLOYEE
    Posted Sep 26, 2019 06:39 PM

    Hey Parnassus, We didn't feed data from the 8320 core switch, but we did from the Gateway to Grafana/Kibana.


  • 4.  RE: From Network Operations Center of Aruba Atmosphere 2019 APAC

    Posted Sep 30, 2019 04:48 PM

    That load balancing...very satisfyingload.JPG


  • 5.  RE: From Network Operations Center of Aruba Atmosphere 2019 APAC

    Posted Sep 30, 2019 08:46 PM
    Isn't Grafana just the front end? Don't you need some DB to ingest the feeds? Would love more info on how to setup something similar! Great work!


  • 6.  RE: From Network Operations Center of Aruba Atmosphere 2019 APAC

    EMPLOYEE
    Posted Oct 01, 2019 02:19 AM

    You are right. 

    We have used the pre-canned image from Aruba.
    The database here (esdb) is Elasticsearch.


  • 7.  RE: From Network Operations Center of Aruba Atmosphere 2019 APAC

    Posted Oct 01, 2019 10:21 AM

    Do you have more info on the backend? Would love to be able to utilize similar dashboards.


  • 8.  RE: From Network Operations Center of Aruba Atmosphere 2019 APAC

    EMPLOYEE
    Posted Oct 02, 2019 01:13 AM

    Mate, The Grafana and Kibana dashboards are just to demonstrate the integration capabilities with Aruba devices and showcase how API's can be leveraged to build custom dashboards. Since we don't sell those products, I wouldn't be able to share much information on this.

    May be this post might help.

    https://community.arubanetworks.com/t5/Wireless-Access/Aruba-AOS8-InfluxDB-and-Grafana-How-to-create-your-own-custom/td-p/480407