Wireless Access

last person joined: 13 hours ago 

Access network design for branch, remote, outdoor, and campus locations with HPE Aruba Networking access points and mobility controllers.
Expand all | Collapse all

Aruba AOS8, InfluxDB and Grafana: How to create your own custom dashboard

This thread has been viewed 50 times
  • 1.  Aruba AOS8, InfluxDB and Grafana: How to create your own custom dashboard

    EMPLOYEE
    Posted Oct 29, 2018 12:58 PM
      |   view attached

    "Data is the new oil" was mentioned by The Economist 1 year ago, and networking is not the exception to the norm: Customers are demanding personalized reports where they can visualize trends, issues, anomalies and alerts on their networks in order to take actions speedily, either to guarantee an excellent quality in the service to the final users or to identify a new business opportunity.


    This article shows how to create a custom dashboard using AOS8 APIs, InfluxDB (to store the data indexed by time), and Grafana to visualize the information.


    Figure No 1 is an example of my custom dashboard running at home, it monitors traditional variables as status of Access Points but also complex variables as CRC counters per Radio per Access Point.  Attached to this article you will find the step by step guide to setup your own demo.
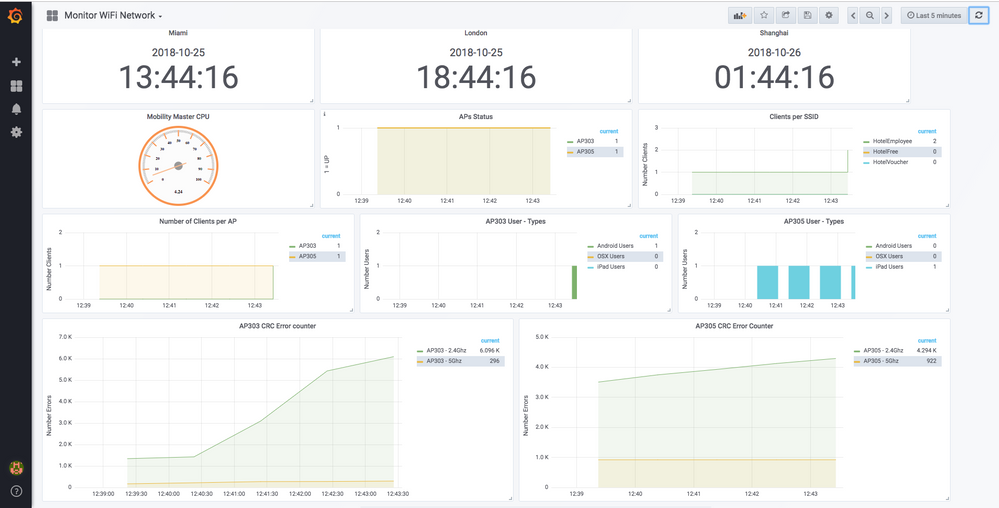
    Figure No 1Figure No 1

    Physical Design


    WiFi network is powered by Aruba virtual Mobility Master, virtual Mobility Controller, Clearpass and Aruba Access Points.
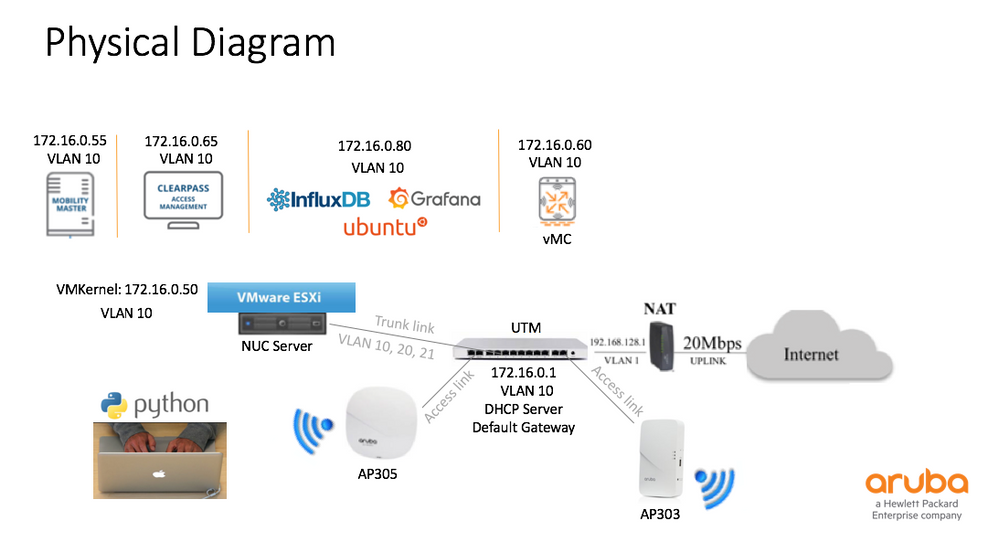
     

    Figure No 2Figure No 2

    Logical Design


    Any show command in AOS8 can be run using the API model and the JSON response will be available for the same.  Figure number 3 shows how using a recurrent, 60 seconds - python script (main.py), multiple show commands can be executed and responses are stored on InfluxDB.
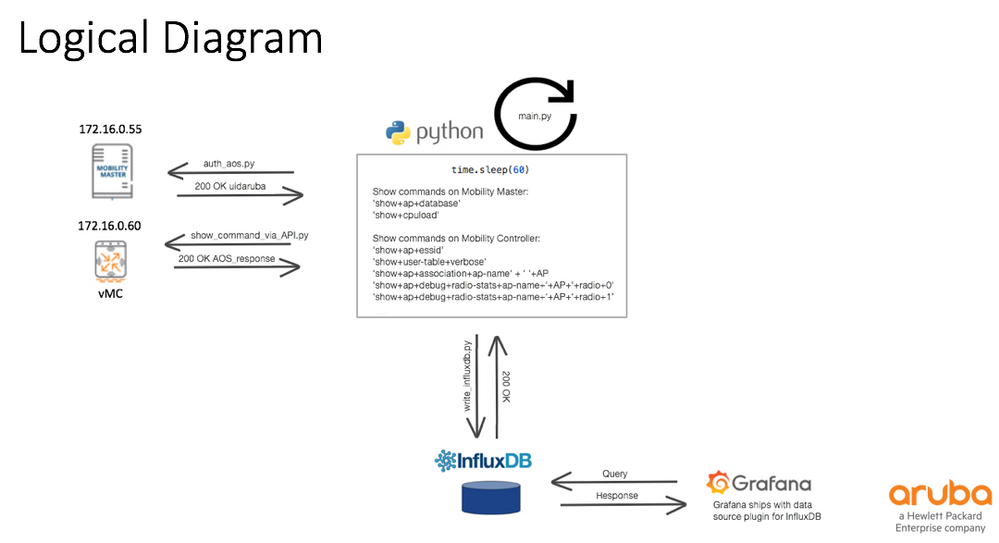
     

    Figure No 3Figure No 3

    Details of InfluxDB


    Slides 59, 60 and 61 show the details about InfluxDB design. Please download the step by step guide attached to this article.


    Details of Grafana


    Slides 63 shows how to send queries from Grafana to InfluxDB in order to visualize the data and generate custom reports.


    Details of Python Script

    https://github.com/adolfobolivar/AOS8-InfluDB-Grafana


    aut_aos (username, password, AOS IP) function is responsible for communicating with Mobility Master and Mobility Controller to obtain a new UIDARUBA token (Access Token).

    Picture1.png


    show_command(AOS IP, UID Aruba token, command) function also communicates with Mobility Master and Mobility Controller via APIs to obtain the information of interest.

    Picture2.png


    ap_database(data), cpu_load(MM IP Address, data), clients_per_ssid (MC IP Address, data), users_type(MC IP Address, data), ap_associations(data, AP Name), and ap_statistics(data, AP Name, radio) functions are responsible for parse the information provided by Master and/or Mobility Controller, and adjust the format of the data of interest to be able to write them in InfluxDB.


    This is how each function is mapped to a show command:


    • ap_database --- 'show+ap+database'
    • cpu_load ---  'show+cpuload'
    • clients_per_ssid --- 'show+ap+essid'
    • users_type --- 'show+user-table+verbose'
    • ap_associations --- 'show+ap+association+ap-name' + ' '+AP
    • ap_statistics --- 'show+ap+debug+radio-stats+ap-name+'+AP+'+radio+0' and 'show+ap+debug+radio-stats+ap-name+'+AP+'+radio+1'

    Let’s check the ap_database(data) function in detail:   Figure 4 shows the answer from Mobility Master to the 'show+ap+database' command via API and the information of interest highlighted in orange color. 
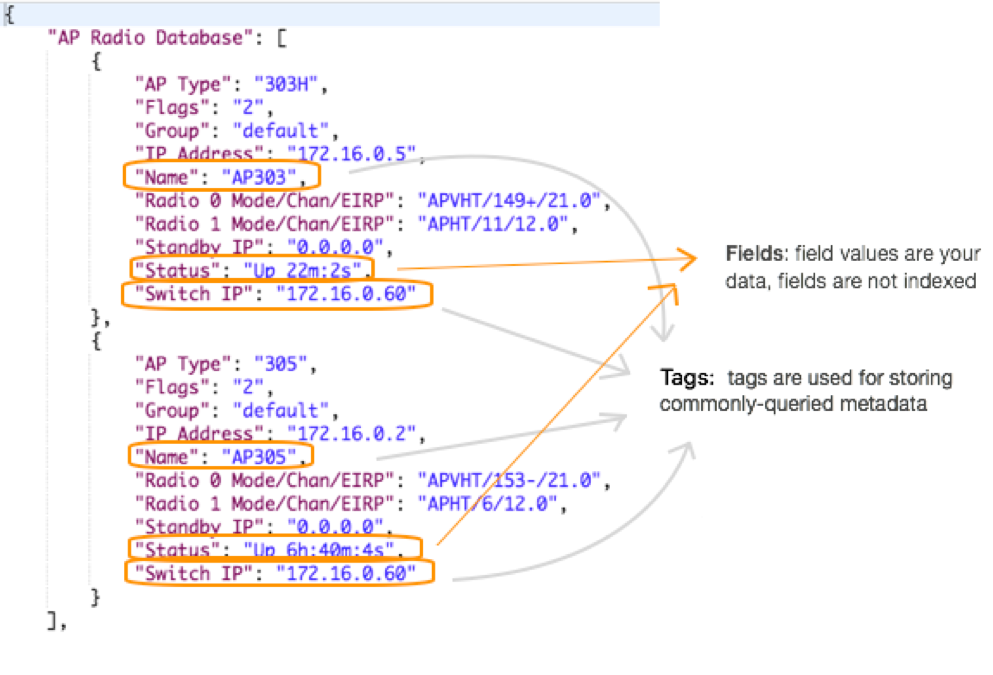
    Figure No 4Figure No 4

    ap_database(data) function changes the “Status” from “Up” to 1 and anything else (for example “Down”) to 0.   Then, the function adjusts the data as required by InfluxDB. It creates the measurement name “Status of APs”, it lists “AP Name” and “Switch IP (Mobility Controller IP)” as Tags and “Status” as Field.   
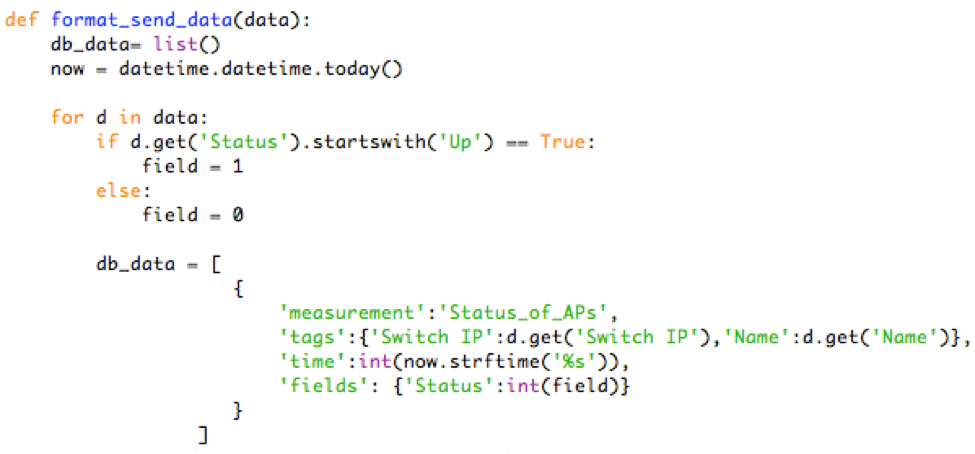
    Picture5.png


    write_influxdb (data) function writes the information on “example” database.

    Picture6.png


    Result:

    Here is how the Dashboard looks in Grafana


    (view in My Videos)


    References:


    https://www.arubanetworks.com/techdocs/ArubaOS_83_Web_Help/Content/PDFs/ArubaOS%208.3.0.x%20API%20Guide.pdf

    https://github.com/michaelrosejr/pyaos8

    https://github.com/surajpasuparthy/grafana-influx

    https://github.com/influxdata/influxdb-python

    Attachment(s)

    pdf
    AOS8_Influxdb_Grafana.pdf   4.75 MB 1 version


  • 2.  RE: Aruba AOS8, InfluxDB and Grafana: How to create your own custom dashboard

    Posted Sep 19, 2019 03:36 PM

    Adolfo,


    I'm getting the following error when trying to run the main.py script and I can't seem to figure out why.  Any ideas?


    Status: 401 Headers: {'Date': 'Thu, 19 Sep 2019 19:34:38 GMT', 'Server': 'Apache', 'Set-Cookie': '=(null); path=/;secure=;, CPnextpin=; path=/; expires=Sat, 01-Jan-1970 00:00:00 GMT;', 'X-Frame-Options': 'SAMEORIGIN', 'X-XSS-Protection': '1; mode=block', 'X-UA-Compatible': 'IE=edge;IE=11;IE=10;IE=9', 'Expires': '0', 'Content-Length': '97', 'Keep-Alive': 'timeout=15, max=96', 'Connection': 'Keep-Alive', 'Content-Type': 'application/json'} Error Response: Unauthorized
    Traceback (most recent call last):
    File "main.py", line 22, in <module>
    list_ap_database = show_command_via_API.show_command(vMM_aosip,token,command)['AP Database']
    File "/home/grafana/AOS8-InfluDB-Grafana/show_command_via_API.py", line 11, in show_command
    url_login = 'https://' + aosip + ':4343/v1/configuration/showcommand?command='+command+'&UIDARUBA=' + uidaruba
    TypeError: must be str, not NoneType


  • 3.  RE: Aruba AOS8, InfluxDB and Grafana: How to create your own custom dashboard

    EMPLOYEE
    Posted Sep 20, 2019 10:21 AM

    401 Headers means "Unauthorized", looks like your Cookie (to get access to Controller) expired or it's not valid. 


    Regards,


  • 4.  RE: Aruba AOS8, InfluxDB and Grafana: How to create your own custom dashboard

    EMPLOYEE
    Posted May 14, 2020 02:39 PM

    Very nice... Will this work with Instant as well, or just MC/MM? 


  • 5.  RE: Aruba AOS8, InfluxDB and Grafana: How to create your own custom dashboard

    EMPLOYEE
    Posted May 14, 2020 05:27 PM

    Register the IAPs to Central and you will have hundreds of APIs available to be consumed by the python script, save the information in dB, and then graph the information using Grafana


  • 6.  RE: Aruba AOS8, InfluxDB and Grafana: How to create your own custom dashboard

    EMPLOYEE
    Posted May 18, 2020 07:35 AM

    Excellent - I'm hoping to use something like this as part of some of our field deployments, where we won't be using Central, but I can put the home lab into Central. Any efforts to port this to Go and integrate with telegraf? 


    And if you've got a Postman collection for the various APIs that you can share, I'd love to have it. 


  • 7.  RE: Aruba AOS8, InfluxDB and Grafana: How to create your own custom dashboard

    Posted Oct 22, 2020 10:36 AM

    Anybody can help me with query to show:

    1. RX and TX trasmited by AP.

    2. Summary RX and TX transited by controller.


    I try with:

    1. SELECT non_negative_derivative(sum("Rx Data Bytes"), 1s) *8 FROM "Bandwidth_Consumed_CRCs" WHERE ("Name" = 'AP01') AND $timeFilter GROUP BY time(1s) fill(none)


    2. SELECT non_negative_derivative(mean("Tx Data Bytes Transmitted"), 5m) *8 FROM "Bandwidth_Consumed_CRCs" WHERE $timeFilter GROUP BY time(5m) fill(none)


    But i get wrong value.


    For first query i need value/sec.

    For secong query i want avg. value from 5 min.


    Thanks.


  • 8.  RE: Aruba AOS8, InfluxDB and Grafana: How to create your own custom dashboard

    Posted Oct 11, 2023 03:41 AM

    Hello Adolfo, 

    Thank you for sharing, this article is very helpfull.. we have been implemented using this script and work successfully through influxDB 

    but, once we try to connect to grafana, data not available, would you like to share your json for grafana dashboard? 

    Thanks