Wireless Access

last person joined: 20 hours ago 

Access network design for branch, remote, outdoor, and campus locations with HPE Aruba Networking access points and mobility controllers.
Expand all | Collapse all

ArubaOS 8.3 Cluster load balancing and heartbeat

This thread has been viewed 20 times
  • 1.  ArubaOS 8.3 Cluster load balancing and heartbeat

    Posted Oct 03, 2018 04:27 PM

    Capture10.JPG


    2 different issues here, I've had a support ticket open a couple weeks but trying here to see if anyone has ideas. This is Aruba 8.3 with 3 x 7210's in a cluster. Redudancy is on.


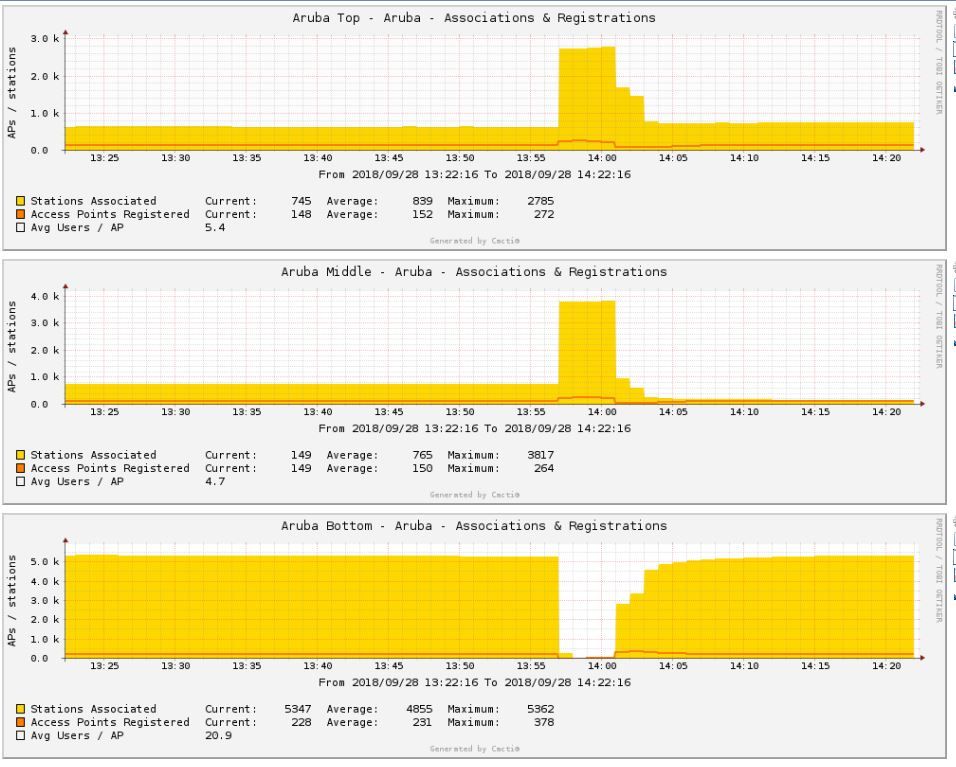
    1. The client count per controller is severely unbalanced. For example, today I had almost 6000 clients on one controller, 160 on another and about 30 on another. From my reading these controllers handle about 16,000 clients, with redundancy cutting that in half to 8,000. My settings are at the default of 50% active, 75% standby, 5% unbalance. That means 4000 active, 6000 standby, 400 unbalance and it moves. Why in the world isn't it moving some of those 6000 off of the controller?


    2. At about the same 30 minute timeframe, a couple times per week, the controller that has 95% percent of the clients on it (see above) decides to move all of them off to another controller. It moves them all to another controller, then about 30 minutes later, they all get moved back to the controller they were previously on. See the above image. I'm assuming here, that it is missing heartbeats and moving them off? The controllers are all sitting on top of each other in the same rack with ping times sub 1ms over 10Gb.


    Cluster Heartbeat Counters
    --------------------------
    IPv4 Address         RES      RSR   MIS  HMPD LMRPD  IDPD CPDPD CDPD LMHINT                     LTOD
    --------------- -------- -------- ----- ----- ----- ----- ----- ---- ------ ------------------------
        10.10.10.5   170462   170462     0     4     1     0     0     0    396 Wed Oct  3 10:34:11 2018

        10.10.10.6   170498   170443    55     3     2     0     0     0    394 Wed Oct  3 10:34:11 2018


    Cluster Heartbeat Counters
    --------------------------
    IPv4 Address         RES      RSR   MIS  HMPD LMRPD  IDPD CPDPD CDPD LMHINT                     LTOD
    --------------- -------- -------- ----- ----- ----- ----- ----- ---- ------ ------------------------
        10.10.10.5   171119   171059    60     4     1     0     0     0    383 Wed Oct  3 10:34:11 2018

        10.10.10.7   188868   188803    65     4     0     0     0     0    378 Wed Oct  3 10:00:33 2018


    Thanks


  • 2.  RE: ArubaOS 8.3 Cluster load balancing and heartbeat

    Posted Oct 03, 2018 07:23 PM

    1. What's the full copied output of the following command for your cluster?


    show lc-cluster group-membership

    2. What's the uplink of each of your controllers? Single 10G link to a distribution switch, VSS, dual 10G links, etc? Happen to have a network diagram? Was curious as were having some issues with our load-balancing and heartbeats - TAC recommended tweaks to our load-balancing settings.


  • 3.  RE: ArubaOS 8.3 Cluster load balancing and heartbeat

    Posted Oct 04, 2018 08:24 AM

    Single 10Gb per controller direct SFP


    Cluster Enabled, Profile Name = "JCSD"
    Redundancy Mode On
    Active Client Rebalance Threshold = 50%
    Standby Client Rebalance Threshold = 75%
    Unbalance Threshold = 5%
    AP Load Balancing: Enabled
    Active AP Rebalance Threshold = 50%
    Active AP Unbalance Threshold = 5%
    Active AP Rebalance AP Count = 10
    Active AP Rebalance Timer = 5 minutes
    Cluster Info Table
    ------------------
    Type IPv4 Address    Priority Connection-Type STATUS
    ---- --------------- -------- --------------- ------
    self     10.10.10.5      128             N/A CONNECTED (Leader)
    peer     10.10.10.6      128    L2-Connected CONNECTED (Member, last HBT_RSP 58ms ago, RTD = 0.511 ms)
    peer     10.10.10.7      128    L2-Connected CONNECTED (Member, last HBT_RSP 58ms ago, RTD = 0.000 ms)


  • 4.  RE: ArubaOS 8.3 Cluster load balancing and heartbeat

    Posted Oct 05, 2018 11:03 AM

    I cant help with your issue, but i am very curious which MIB/oid you are using for getting the ap's association count to your controllers.  I searched for that one and cant seem to find it.  The only one i can find shows the total ap's in the cluster not just on the controller.  


    EDIT: Nevermind, finally found it.  I was looking at the switch MIB not the HA Mib file. 

    values i was looking for were:

    haActiveAPs - 1.3.6.1.4.1.14823.2.2.1.20.1.2.1.1.0

    haStanbyAPs - 1.3.6.1.4.1.14823.2.2.1.20.1.2.1.2.0

    haTotalAPs - 1.3.6.1.4.1.14823.2.2.1.20.1.2.1.3.0


  • 5.  RE: ArubaOS 8.3 Cluster load balancing and heartbeat

    Posted Oct 05, 2018 12:48 PM

    You found it already, but yes, I'm using


    1.3.6.1.4.1.14823.2.2.1.20.1.2.1.1.0


    for AP's


  • 6.  RE: ArubaOS 8.3 Cluster load balancing and heartbeat

    Posted Oct 05, 2018 01:22 PM
     wrote:

    Single 10Gb per controller direct SFP


    Cluster Enabled, Profile Name = "JCSD"
    Redundancy Mode On
    Active Client Rebalance Threshold = 50%
    Standby Client Rebalance Threshold = 75%
    Unbalance Threshold = 5%
    AP Load Balancing: Enabled
    Active AP Rebalance Threshold = 50%
    Active AP Unbalance Threshold = 5%
    Active AP Rebalance AP Count = 10
    Active AP Rebalance Timer = 5 minutes
    Cluster Info Table
    ------------------
    Type IPv4 Address    Priority Connection-Type STATUS
    ---- --------------- -------- --------------- ------
    self     10.10.10.5      128             N/A CONNECTED (Leader)
    peer     10.10.10.6      128    L2-Connected CONNECTED (Member, last HBT_RSP 58ms ago, RTD = 0.511 ms)
    peer     10.10.10.7      128    L2-Connected CONNECTED (Member, last HBT_RSP 58ms ago, RTD = 0.000 ms)


    Our situation was different/unique, but in our case this is what happened to us: For about a month, our cluster of 4x7420XMs (8.2.1.1) was in a unstable state where APs/clients would move around 4 times a day due to hearbeat loss. We though some situations it was due to the controller being unresponsive as I caught notice of a couple times where the "mDNS process" crashes approximate time of the fail-over - which i think may still have been the case a couple times:


    show crashinfo


    The big instability, and I'm hoping to investigate the root cause in the future once get the time on our test controller. Our production environment consists of 4x7240XM Controllers in a single cluster - split between two datacenters - with uplinks to a VSS Distribution Pair - with a VSL Link between the two. Each Controller has a 10G uplink to it's local VSS of the pair - and then another 10G uplink to the remote VSS. What we discovered was once we got the last of the 4 controllers connected with dual 10G links - the hearbeat problems went away - it's been 3 weeks now and highly unusual. What we saw in traffic graphs was the cluster-leader traffic was sending going over the VSL link of the VSS pair - not sure why this would cause any issues as the link is solid - but must be sensitive.


    This leads into the discover of a "load-balance problems" - once the cluster was stabilitzed - clients were ending up almost all on one controller - 16,000 - the highest we've seen on that controller - and saw performance issues - APs rejecting associations due to "AP is resource constrained" - on APs that see no more than 20-30 clients - an error we've only seen in the past due to exceeding the max-association limit set on the SSID. Working with TAC - they believed this was normal as 16,000 was 50% of the Active Client Rebalance Threshold, they had us tweak our cluster settings to acheive what we desired - approximately 8,000 clients on each controller is acheived now.


    Active Client Rebalance Threshold = 25%
    Unbalance Threshold = 3%


    1. I would check with TAC on what their opinion is on the load-balancing logic and if any tweak recommendations? This one they were able to answered fairly quickly - although we only asked this question after the cluster was stable - so that might be throwing off your environment.

     
    2. I would check if there's any crash information on your controllers or low process start times - 

    show crashinfo
    show processes