Android apps are published on the Google Play Store, and Google provides app developers some tools to see where the download action is hottest. I thought this might interest our audience on Airheads, so here are some snips of the Google Developer Console. This shows what’s available to developers, and also the progress we’ve made with Aruba Utilities – not that absolute numbers are the measure of success, I just aim to provide useful tools for engineers working around Aruba WLANs – but data is always of interest to engineers…
First, here’s the dashboard. It's updated nightly:

It shows the latest version is 36, the installation count (more below), a total of ratings/comments and a very important column showing crashes and freezes (but only when the user has sent in the results – there’s a prompt from Android after a crash about whether to report it…. Please, please do this, it gives me a stack trace and I always go straight to the code and fix the bug.)
Now, installation count over time:

First, how does Google count? Your Android device reports when a user downloads an app from Google Play Store, and also if they delete it, this is important for paid apps when there may be a refund due. So I look at ‘active device installs’ rather than ‘total installs’ because that nets out people who downloaded the app but then found it wasn’t for them and deleted it. For this app, we retain about 2/3 of initial downloads. Of course, many of those will never use it, although they aren’t motivated enough to delete it. That’s difficult to quantify. The timescale here shows a fairly constant uptake rate, reaching 2000 from 1Sep12 to 25Apr13: about 8 net installs/day, although the daily install chart (I don’t have space to put them all in here) is periodic on a weekly cycle.
Taking ‘active device installs’ as the metric, Google offers many different slices through the statistics. I have space to show a couple here.
First, by app version. Here’s 3 months’ worth:

You can see I try not to release more than one update a month, but the ver31 had a serious bug (that I only discovered from the initial crash reports, my QA is lacking) so I came out with ver34 just a week later to fix it. The stats reflect whether people have automatic updates enabled, more than anything else I think, although the non-updating installs are probably not being used much.
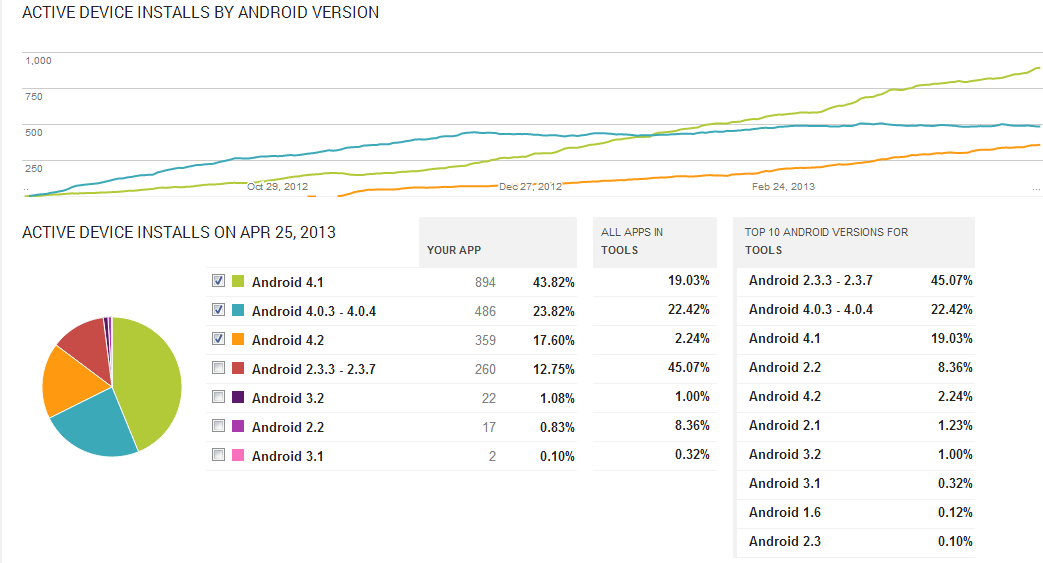
Here’s a breakdown of active device installs by Android version in a 12-month chart:

Aruba Utilities engineers are smarter than the average Androider, or maybe they just spend more on phones, because our distribution is skewed much more to the later versions than the ‘top 10’ for apps in the ‘tools’ category on Google Play Store. And that’s good for me, because I can slowly pull the ‘least supported’ version forwards and reduce the special coding for ‘legacy’ devices that may not offer the latest Android OS features I’d like to use.
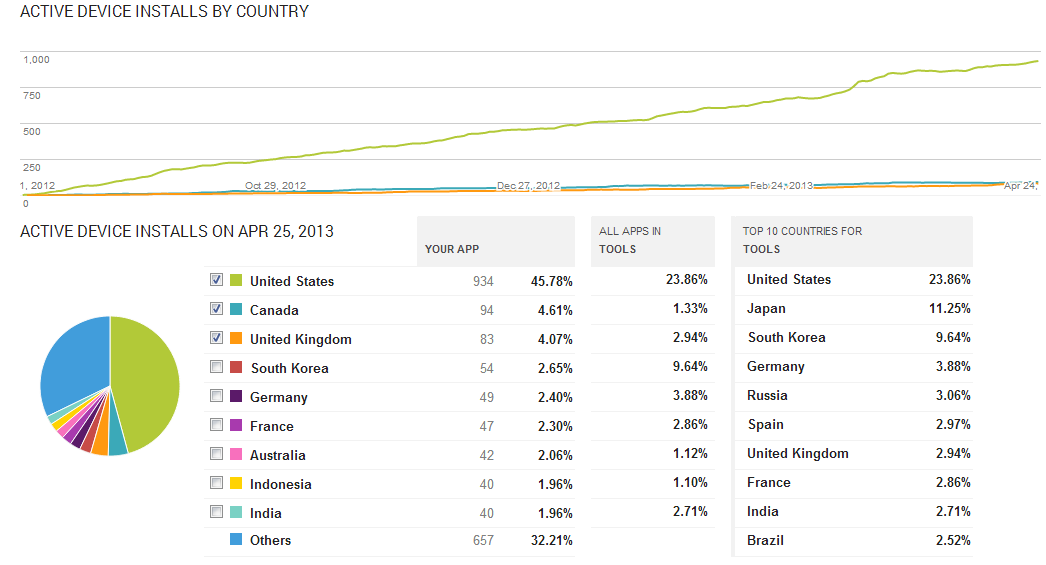
One last chart, this time on geographic distribution. I suspect there’s some self-reporting behind this (I believe the country comes from the Google Play Store account but there are other ways Google might get it). The ‘others’ category is large!

This article was a quick dip into the statistics available on the Google Play Developer Console. If there’s interest, I can give updates in the future.
Best,
Antar