"Data is the new oil" was mentioned by The Economist 1 year ago, and networking is not the exception to the norm: Customers are demanding personalized reports where they can visualize trends, issues, anomalies and alerts on their networks in order to take actions speedily, either to guarantee an excellent quality in the service to the final users or to identify a new business opportunity.
This article shows how to create a custom dashboard using AOS8 APIs, InfluxDB (to store the data indexed by time), and Grafana to visualize the information.
Figure No 1 is an example of my custom dashboard running at home, it monitors traditional variables as status of Access Points but also complex variables as CRC counters per Radio per Access Point. Attached to this article you will find the step by step guide to setup your own demo.
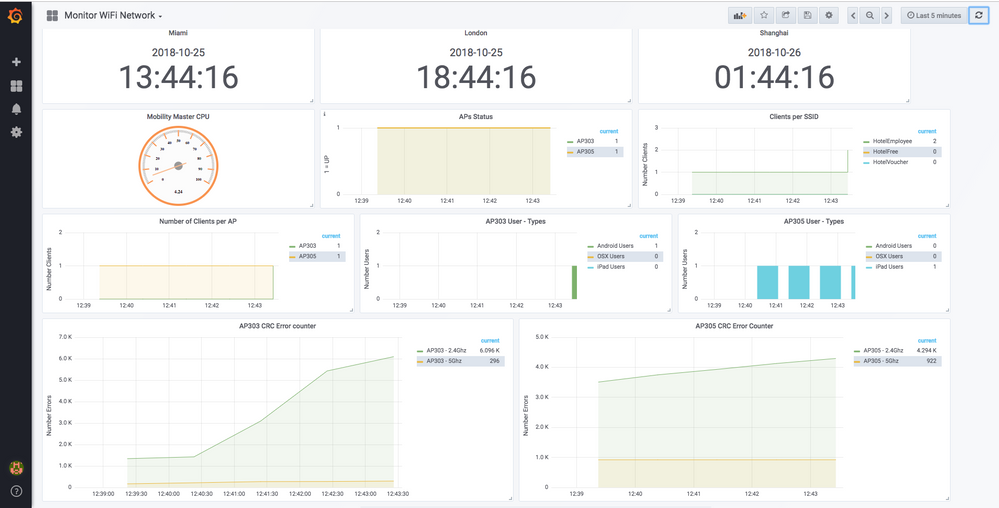 Figure No 1
Physical Design
WiFi network is powered by Aruba virtual Mobility Master, virtual Mobility Controller, Clearpass and Aruba Access Points.
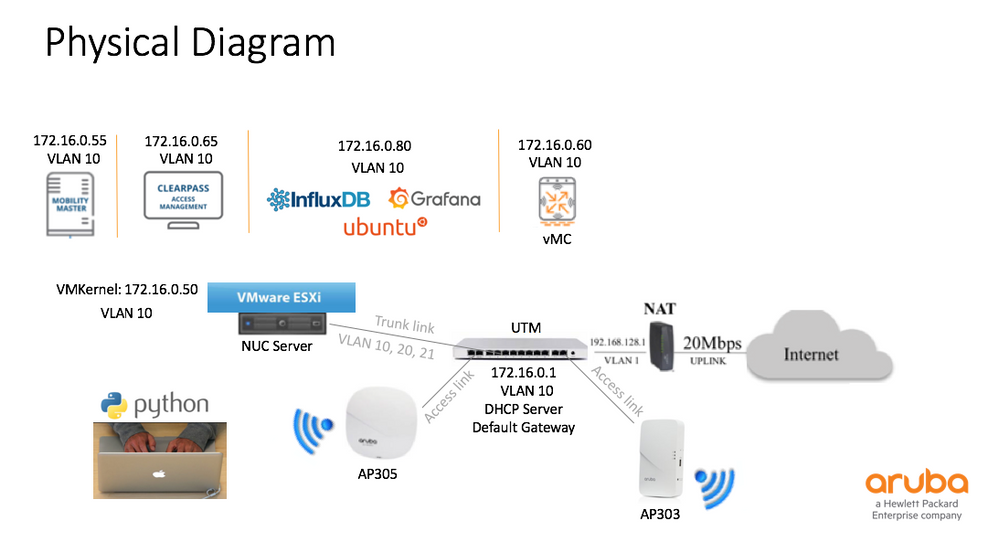 Figure No 2
Logical Design
Any show command in AOS8 can be run using the API model and the JSON response will be available for the same. Figure number 3 shows how using a recurrent, 60 seconds - python script (main.py), multiple show commands can be executed and responses are stored on InfluxDB.
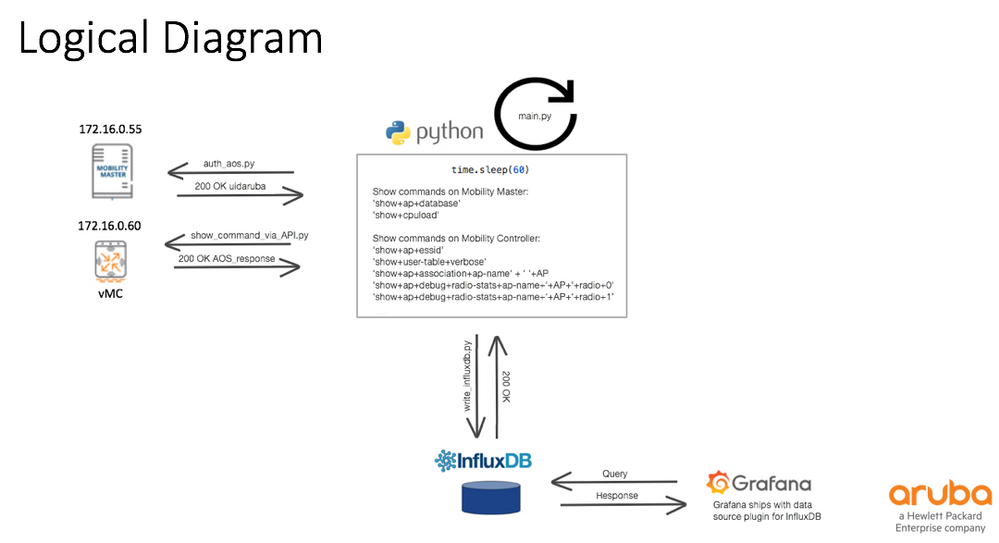 Figure No 3
Details of InfluxDB
Slides 59, 60 and 61 show the details about InfluxDB design. Please download the step by step guide attached to this article.
Details of Grafana
Slides 63 shows how to send queries from Grafana to InfluxDB in order to visualize the data and generate custom reports.
Details of Python Script
https://github.com/adolfobolivar/AOS8-InfluDB-Grafana
aut_aos (username, password, AOS IP) function is responsible for communicating with Mobility Master and Mobility Controller to obtain a new UIDARUBA token (Access Token).

show_command(AOS IP, UID Aruba token, command) function also communicates with Mobility Master and Mobility Controller via APIs to obtain the information of interest.

ap_database(data), cpu_load(MM IP Address, data), clients_per_ssid (MC IP Address, data), users_type(MC IP Address, data), ap_associations(data, AP Name), and ap_statistics(data, AP Name, radio) functions are responsible for parse the information provided by Master and/or Mobility Controller, and adjust the format of the data of interest to be able to write them in InfluxDB.
This is how each function is mapped to a show command:
- ap_database --- 'show+ap+database'
- cpu_load --- 'show+cpuload'
- clients_per_ssid --- 'show+ap+essid'
- users_type --- 'show+user-table+verbose'
- ap_associations --- 'show+ap+association+ap-name' + ' '+AP
- ap_statistics --- 'show+ap+debug+radio-stats+ap-name+'+AP+'+radio+0' and 'show+ap+debug+radio-stats+ap-name+'+AP+'+radio+1'
Let’s check the ap_database(data) function in detail: Figure 4 shows the answer from Mobility Master to the 'show+ap+database' command via API and the information of interest highlighted in orange color.
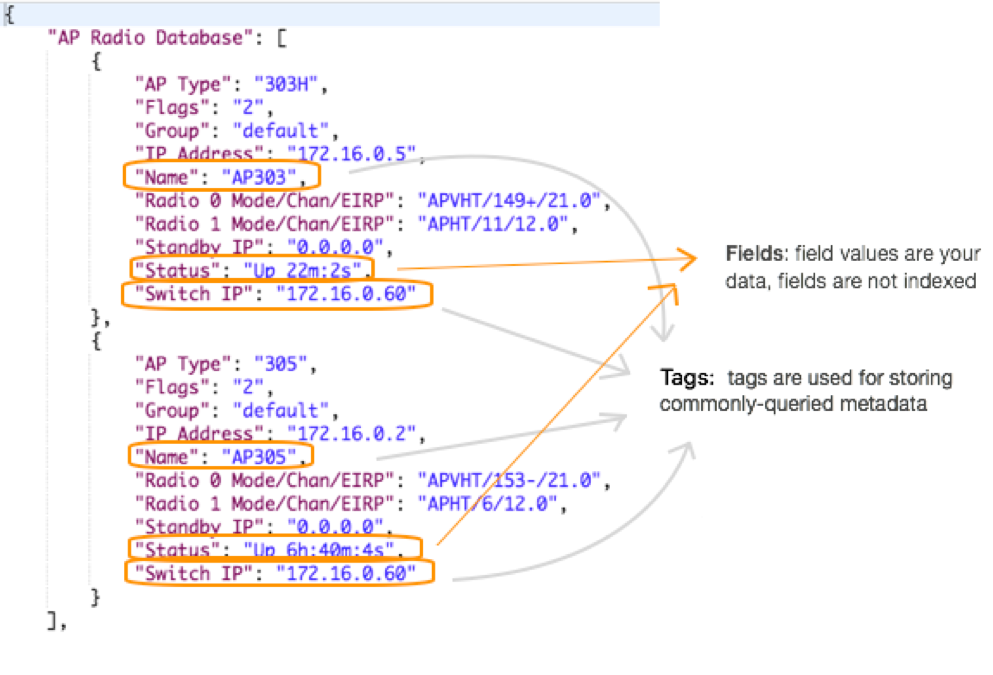 Figure No 4
ap_database(data) function changes the “Status” from “Up” to 1 and anything else (for example “Down”) to 0. Then, the function adjusts the data as required by InfluxDB. It creates the measurement name “Status of APs”, it lists “AP Name” and “Switch IP (Mobility Controller IP)” as Tags and “Status” as Field.
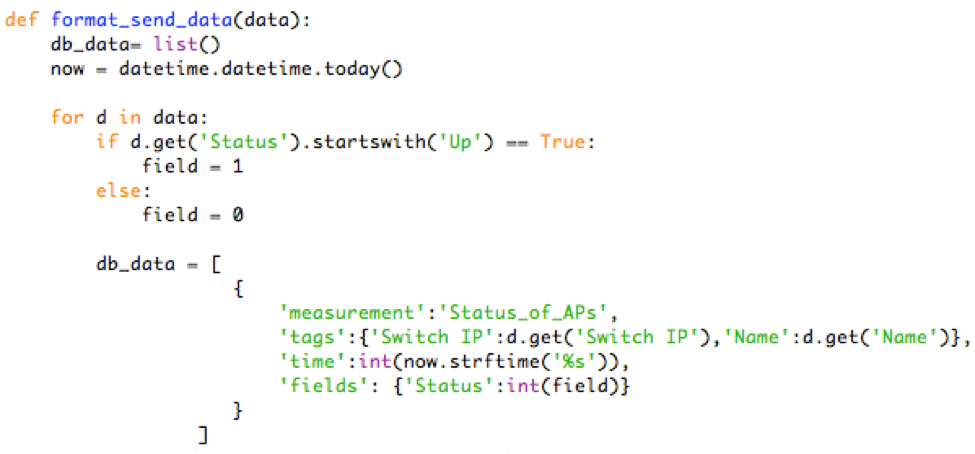
write_influxdb (data) function writes the information on “example” database.

Result:
Here is how the Dashboard looks in Grafana
(view in My Videos)
References:
https://www.arubanetworks.com/techdocs/ArubaOS_83_Web_Help/Content/PDFs/ArubaOS%208.3.0.x%20API%20Guide.pdf
https://github.com/michaelrosejr/pyaos8
https://github.com/surajpasuparthy/grafana-influx
https://github.com/influxdata/influxdb-python